The Liminal Insights Engine shows adoption, usage, and trends as they happen, and Smart Nudges point to where AI can do more.
Rolling out AI is one milestone. Knowing who's using it, how, and where it could do more is what turns a pilot into an organization-wide program. Liminal shows adoption as it happens and recommends where to focus next.
Smart Nudges surface high-value opportunities, workflow gaps, and training needs, drawn from how your organization actually uses AI.
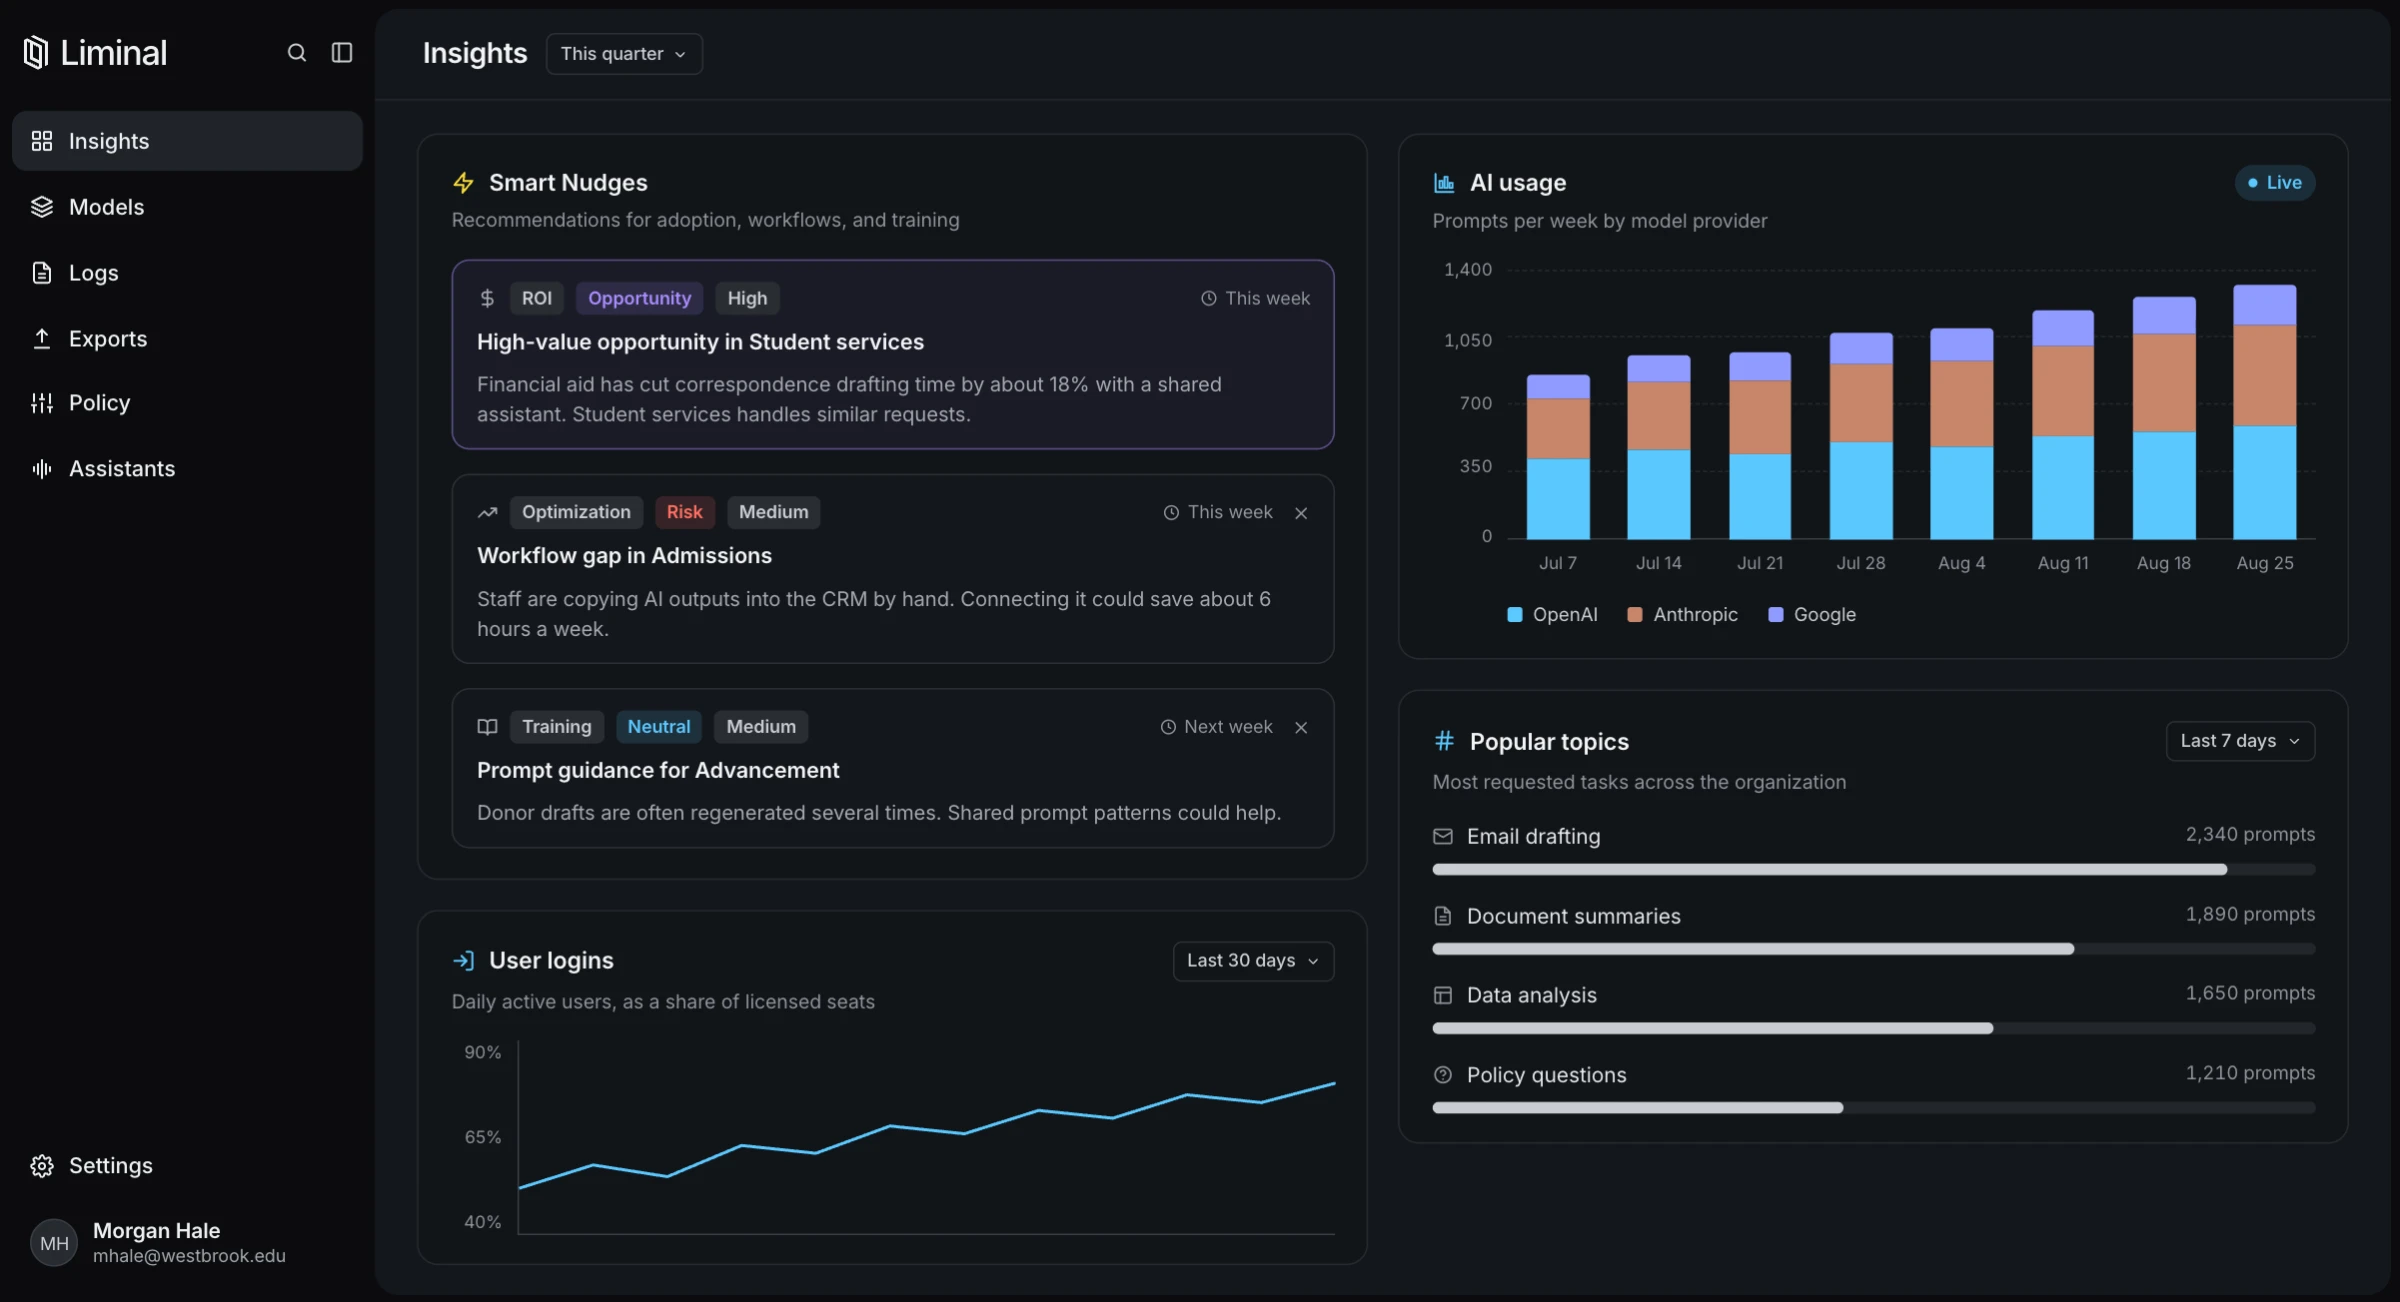
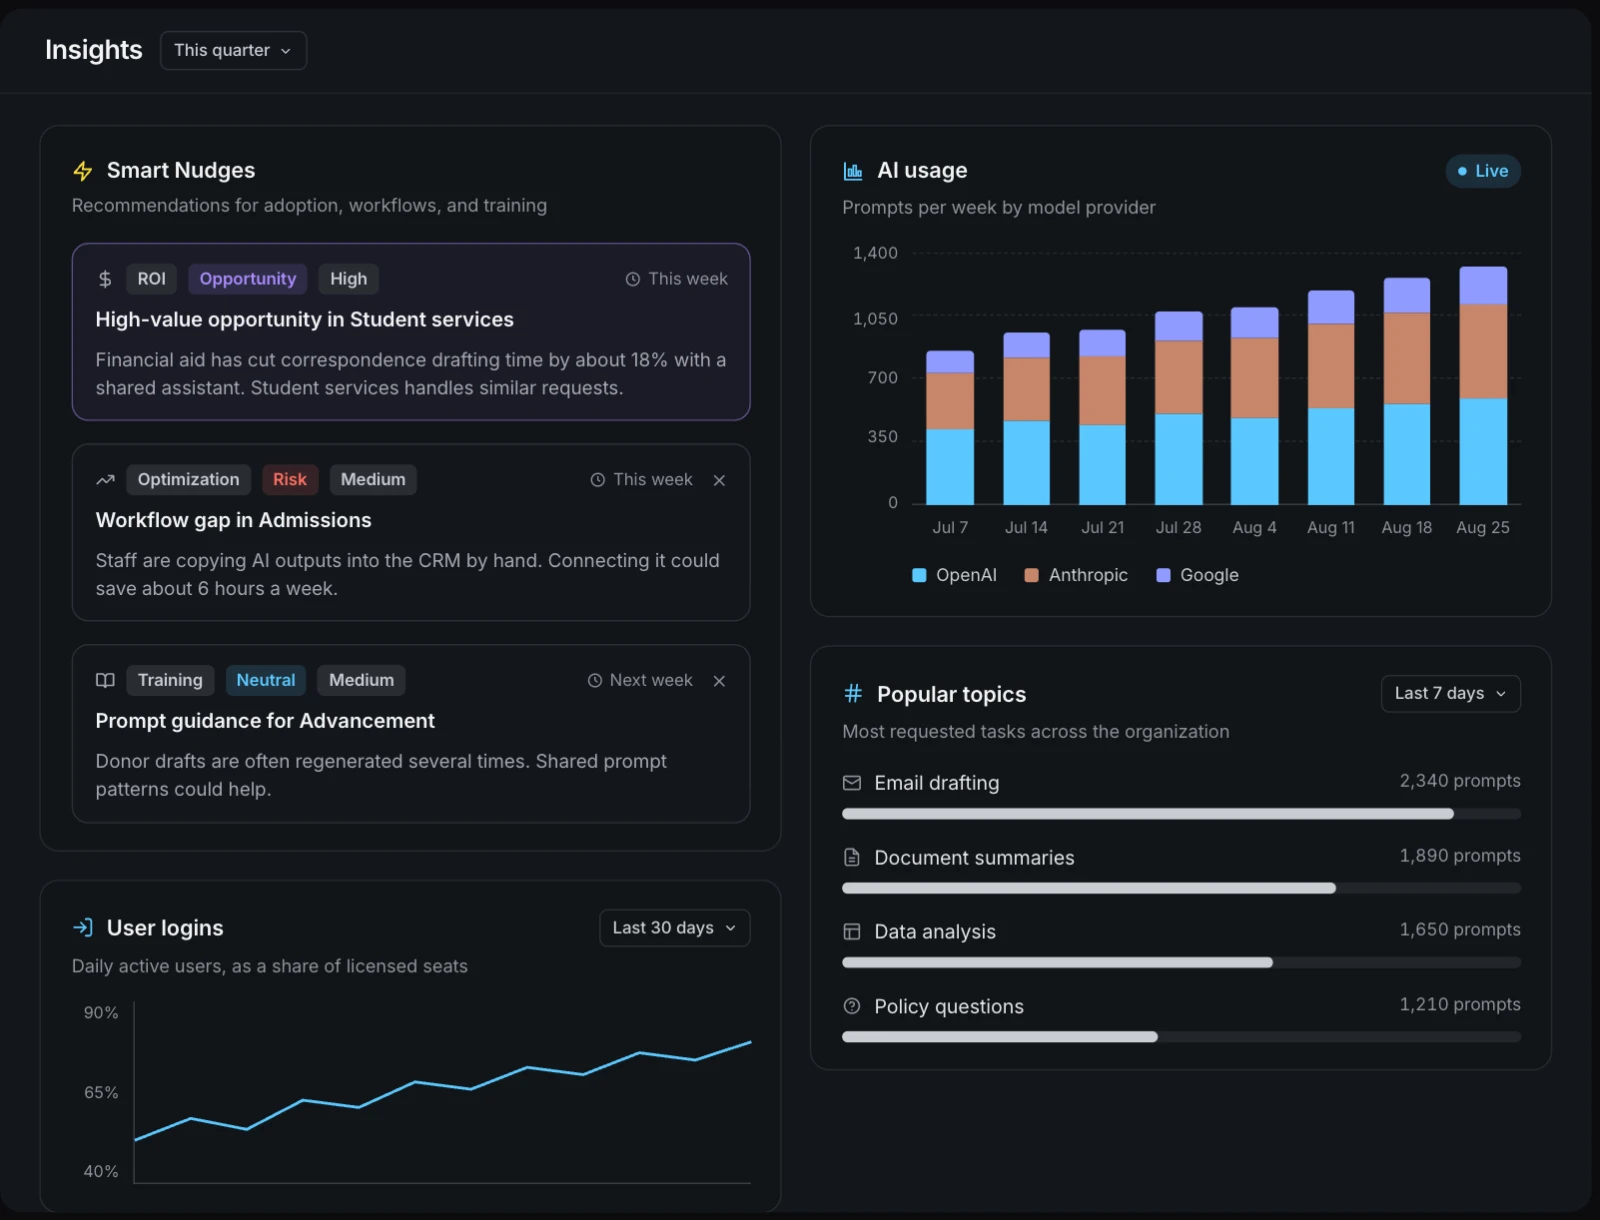
Model usage, logins, and role usage across the organization, updated as it happens.
Topics show what people use AI for most, from drafting to analysis.
Counts of protected data show where safeguards are working, without exposing the details themselves.
Smart Nudges flag opportunities, risks, and progress, each with a recommended next step.
From discovering how AI is used to proving what it's worth, every step of the platform works together.
Detailed prompt logs are visible only to super admins and roles granted log access. The Insights dashboard shows usage in aggregate, and Smart Nudges are designed not to single out individuals.
Every six hours, from patterns across conversations. Each nudge has a category, a signal (neutral, opportunity, risk, or progress), a priority, and a recommended action.
Yes. Logs can be downloaded or exported on a schedule to AWS, Azure, or Google Cloud storage for use in BI tools.
The Insights dashboard shows how AI is used across your organization: which models people use, how often they sign in, and which topics their work covers. Conversations are grouped by topic, so you can see where AI is already helping and where it could do more. Sensitive data appears as counts by type, never the values themselves.
Tell us about your team and we'll show you how Liminal fits your environment.
